The Debugging Starter Kit
May 9, 2020
Debugging is hard work. It’s so hard that people expect that debugging will take 50% of the project time.
Good practices minimize bugs. We talked about disciplined development using Test-driven Development.
But we know no code is perfect. And that’s okay.
But the question is… How can we reduce the debugging time?
Any Fool Can Write Code
A short quote from Martin Fowler, the author of Clean Code.
Any fool can write code that a computer can understand. Good programmers write code that humans can understand. Martin Fowler.
And from Jack Ganssle. He shared his wisdom on being a good embedded software engineer on this Embedded.fm Podcast episode.
Any idiot can create code; professionals find ways to consistently create high-quality software on time and on budget. Jack Ganssle
Writing software is more than typing on the keyboard and compiling. It’s a process.
Professionals have discipline.
They have a well-defined software development process.
That’s why their results are predictable.
In term of time and quality.
That means they have mastered different tools as well. You’ll learn in this post the debugging tools.
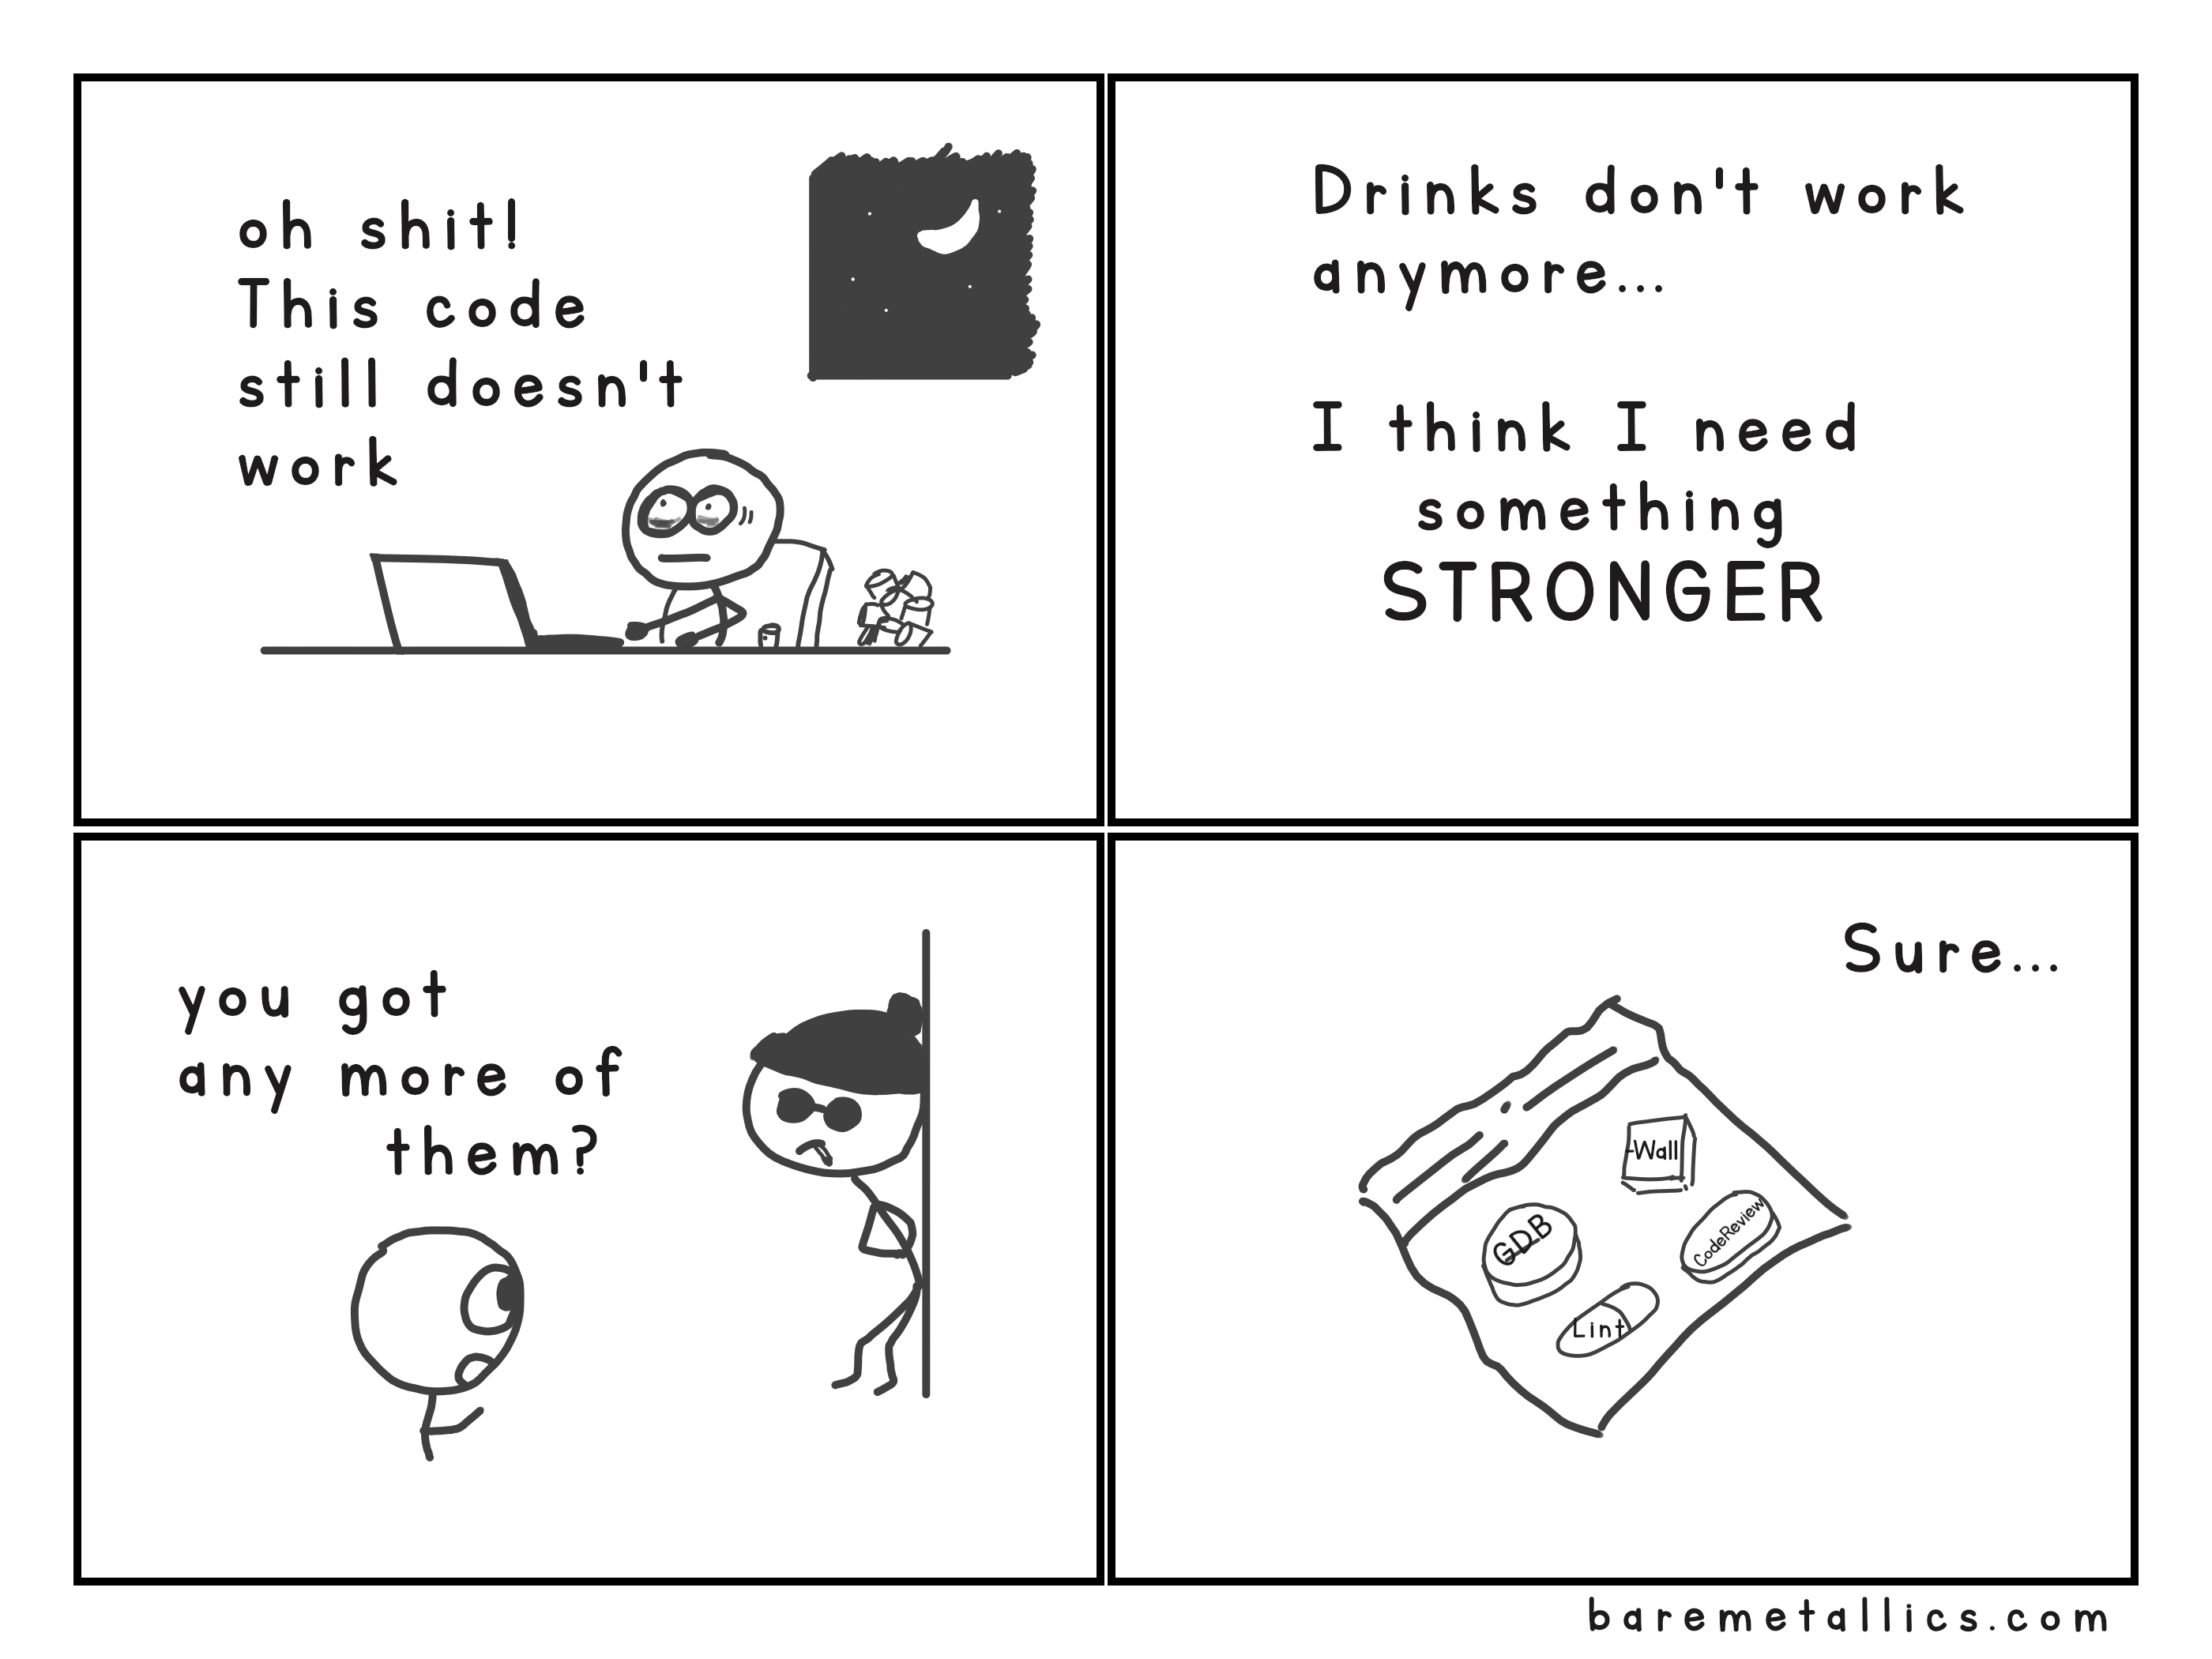
Debugging Starter Kit
THE GCC Flag
Always compile your code with -Wall flag. It’s short for “warn all”
It turns on, almost, all the warnings that GCC can tell you about.
Any warning is a potential bug.
This is your first line of defense.
Use it. It’s free.
Lint
Have you ever heard of Static Analysis? A “static analyzer” checks your code for suspicious areas without running it.
The most common in the embedded world is Lint. There are free and paid versions.
Lint is like the compiler’s syntax checker. But on steroids.
Lint can watch variables and functions usage across multiple files. Your compiler cannot do that.
Code Review
Many experienced developers agree on something. Code review or Peer review.
When we write code we make mistakes. We can ignore some coding standards. For example, int instead of int32_t.
Or we may ignore test cases. For example, we may forget that February can have 29 or 28 days.
Code review is the silver bullet!
That happens because we are so close to the tornado that we can’t have a clear view.
That’s why code review is about getting someone else to check your code. An “expert panel” or more experienced people will review your code along with you. And they will give you their feedback.
Here are some data about code review.
- IBM manages to remove 82% of all defects before testing even starts.
- HP found 80% of the errors detected during inspections were unlikely to be caught by testing.
You can find a Peer Review Checklist for Embedded C Code here.
Honorable Mention: Rubber Duck Debugging
The name comes from a story in the book The Pragmatic Programmer. A developer or engineer explains his/her code to a rubber duck.
It’s “solo” version of code review.
People describe what the code is supposed to do. And they check what it actually does.
And in many cases they find inconsistencies.
GDB
The last line of defense is the debugger. GDB is the most common debugger for C.
GDB is the only tool in this list that runs the code. You can pause the program. You can set breakpoints on the code. Inspect the stack. Check how the variables change their value.
GDB can do a lot of amazing things. But you shouldn’t forget. GDB is the last line of defense.
Summary
Debugging takes a lot of time. But as a professional engineer. You need to use tools to make your work easier, faster, and better. And predictable.
You now have a set of tools. They will help you to find bugs faster. And reduces a lot the overall debugging time. Use them right now in your development.
And if you liked this post. Subscribe right now. You’ll get our stuff directly in your inbox.